Organizational Dashboard Report

- Select Reports from the left-hand menu.
- Locate the Organizational Dashboard report.
- Use the arrow icons to move between pages of the report.
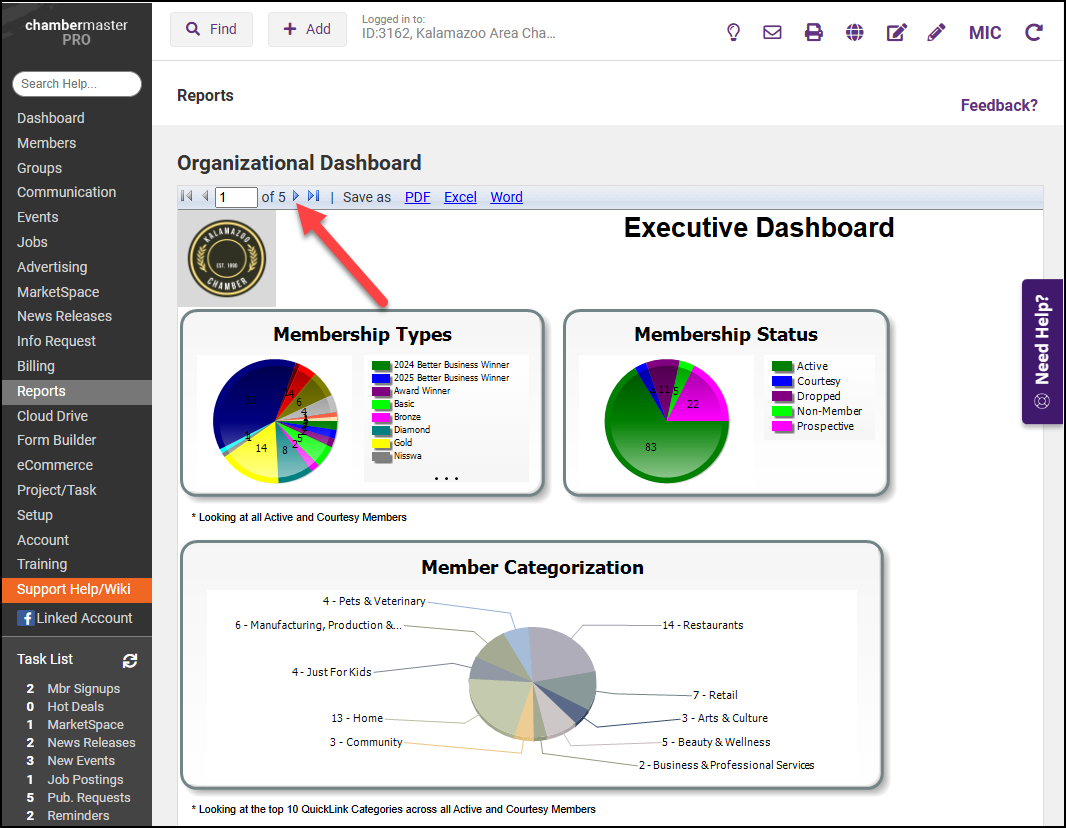
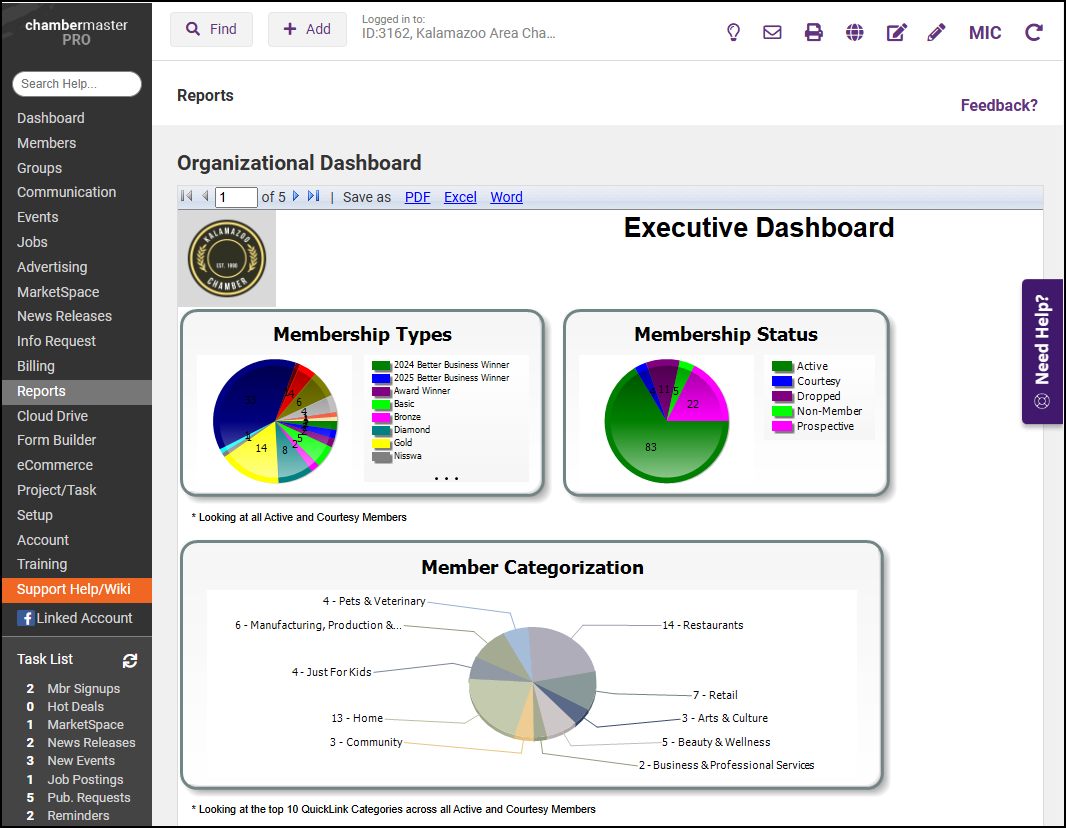
- The first page includes graphs and information on Membership Types, Membership Status, and the top ten Categories for members.
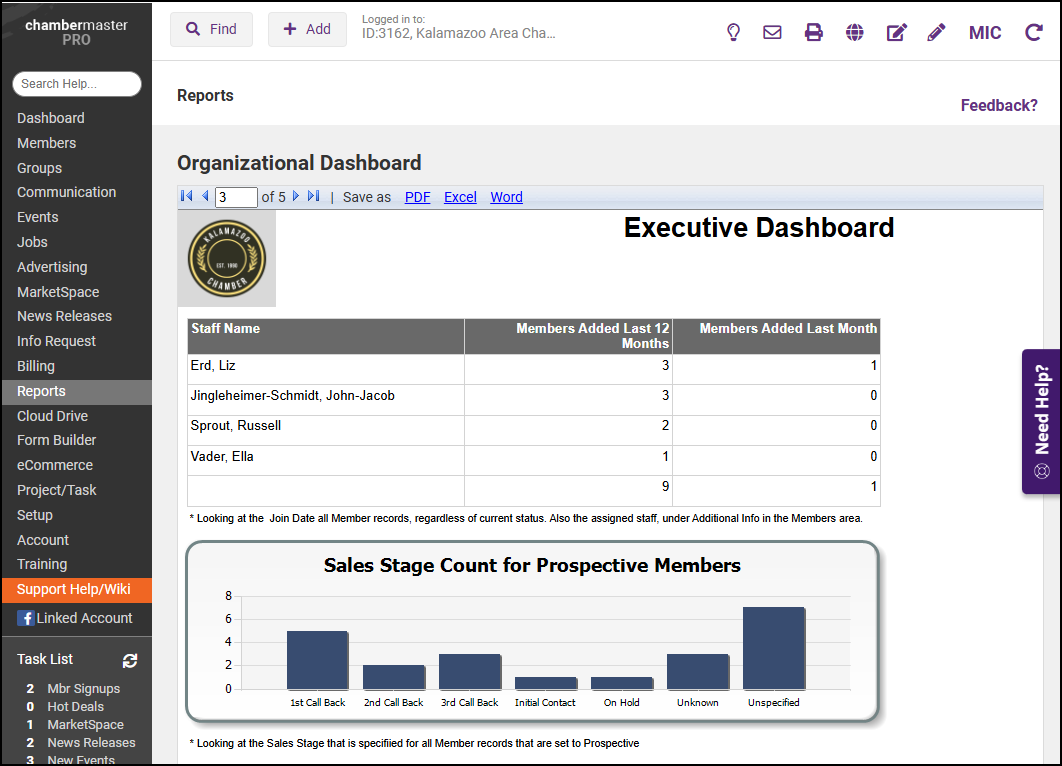
- The third page looks at the Prospective Members staff have converted to Active Members and a graph displaying how many Prospective Members are in each Sales Stage.
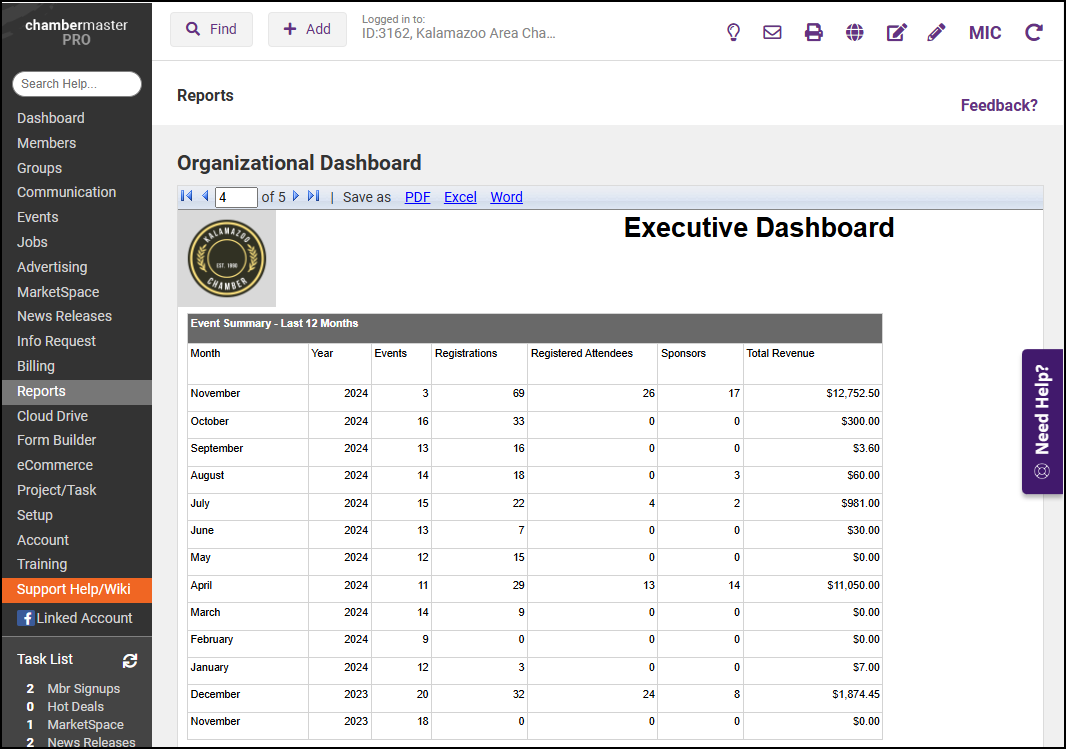
- The fourth page includes a table displaying event information.
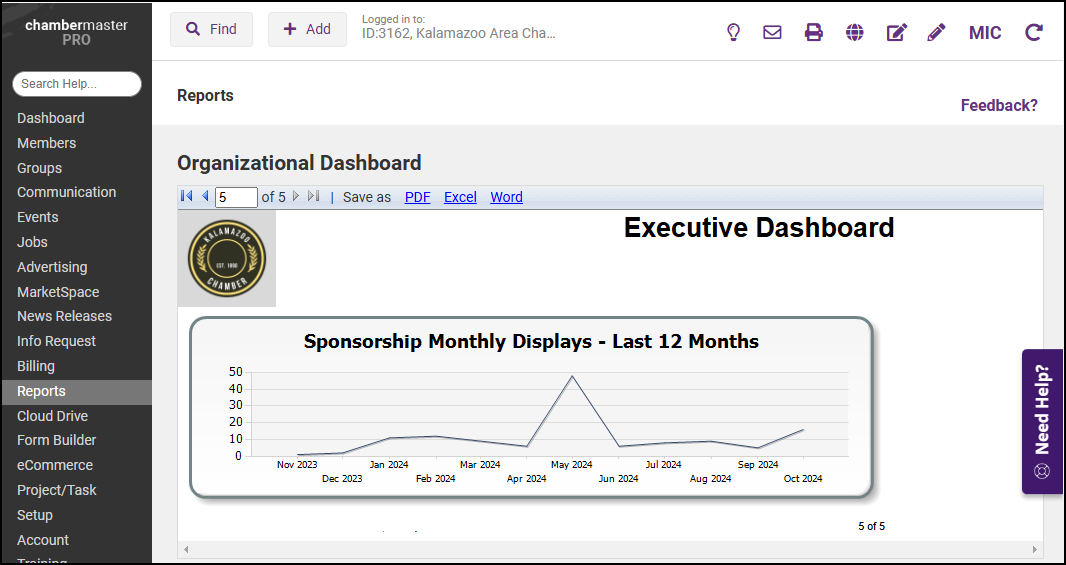
- The last page includes a graph for Sponsorship Monthly Displays.